Herfindahl-Hirschman Index (HHI)

What is Herfindahl-Hirschman
Index (HHI)?
HHI is a score
that helps to measure market concentration and used to determine market
competitiveness. HHI is named after economists Orris C. Herfindahl and Albert O.
Hirschman. It is an economic concept widely applied in competition and
antitrust law. A highly concentration industry is the one where only a few
players dominate the industry by holding a huge market share, leading to a
near-monopolistic industry. Conversely, low degree of concentration refers to
near-perfect competition scenario where many companies hold small market share.
Why is HHI
important to an investor?
HHI helps
to measure market concentration which in turns helps us to determine
profitability is the industry. There is a direct relation between market concentration
and profitability. Low concentration perfect market and in perfect market there
is cut-throat competition. So, it is difficult for the firm to earn above
average returns. High concentration indicates near-monopolistic market and
monopolistic market helps the firm to earn above market return. As an investor,
it is important for us to known profitability of the industry. So, we should
check HHI of the industry before investing in the company.
HHI
Calculation
HHI is
calculated by squaring the market share of each competing firm and then summing
the resulting numbers. HHI value can range from 0 to 10,000. The HHI can have a
theoretical value ranging from close to zero to 10,000. If there exists only a single market
participant which has 100% of the market share the HHI would be 10,000. If there were a great number of market
participants with each company having a market share of almost 0% then the HHI
could be close to zero.
Formula:

Example:

Interpreting
HHI value
HHI score is directly proportional to the concentration in a particular market. That means, a higher HHI value or score reflects a higher concentration in industry and thus reflects lesser competition. Similarly, a lower HHI score would entail the presence of good competition around firms in an industry. A value closer to 10,000 or 1 would indicate the presence of monopoly and a value closer to 0 would indicate healthy competition and almost null concentration among firms.
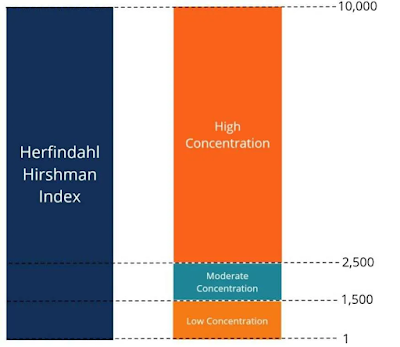
Value between 0 to 1500: It indicates that the industry has low concentration and a competitive industry.
Value
between 1500 to 2500: It indicates that the industry is moderately concentrated
and a healthy competition.
Value higher than 2500: It indicates that the industry is highly concentrated and is a near-monopolistic market.
The primary
advantage of HHI is that it is simple and is less dependent on huge data sources. Rather, it requires only a handful of data to
calculate HHI index. But there are some limitations of HHI. Let us understand
those.
Limitation
of HHI
A major
disadvantage of HHI is that it is simplistic in nature. Since, the formula is
simple it fails to undertake various market adversaries and complexities that
are present in today’s market structure. For example, a company may have small
market share but may hold a dominant position in a particular geographical
market. Also, limitation of defining a market persists in a scenario where
intra-industry competition exists. An industry would look competitive, but each
firm may hold dominant position in a particular market segment. For example, Asian
paints is a dominant player in home decor paint while Nerolac is a dominant
player in industrial paint segment.
To Wrap Up,
Despite its limitation, HHI is a good tool to assess market concentration. High HHI indicates high concentration industry with above average profits. Conversely, low HHI indicates low concentration and below average profits. As an investor, we should invest in companies which come under high concentration industry. Along with HHI, we should also perform PESTLE and Porter analysis and do our own exhaustive research to understand industry structure.
Happy
Investing!
Disclaimer:
Companies used as an example in this blog are for educational purposes and not
an investing advice.


Comments
Post a Comment